Table of Contents >> Show >> Hide
- Why medicine keeps turning gradients into categories
- “Arbitrary” doesn’t mean “made up”
- Seven real-world examples where a single number can change the label
- 1) Diabetes and prediabetes: the A1C “cliff” that isn’t a cliff
- 2) High blood pressure: when definitions change, the population changes
- 3) Cholesterol: the “high” label is partly about risk, not just a lab value
- 4) Obesity: BMI cutoffs are convenient… and incomplete
- 5) Chronic kidney disease (CKD): a time requirement proves the point
- 6) Osteoporosis: a T-score line in the sand, plus fracture reality
- 7) COPD and the “fixed ratio” debate: when the cutoff is openly called arbitrary
- Why these numbers change over time (and why that’s not a scam)
- How to use diagnostic cutoffs without letting them use you
- Conclusion: The number is the start of the story, not the ending
- Experiences related to “Many diseases represent an arbitrary number” (real-life snapshots)
If you’ve ever been told you’re “officially” hypertensive, diabetic, or “now considered” to have chronic kidney disease,
you might have had the same thought many people do: Wait… because of one number?
Here’s the truth that makes medicine feel both smarter and weirder at the same time: a lot of diagnoses are built on
cutoff pointsnumbers drawn on a continuum. Human bodies don’t flip a switch at midnight and announce,
“I have entered the diabetes era.” Biology is gradual. Risk is gradual. But clinical decisions require lines in the sand,
even when the beach keeps moving.
This article explains why many diseases represent an “arbitrary number,” where those numbers come from, why they change,
and how to use them as a toolwithout letting a borderline result hijack your peace of mind.
Why medicine keeps turning gradients into categories
Many common health measurements are continuous: blood pressure, blood sugar, cholesterol, body weight, bone density,
kidney filtration. If you graph them, you don’t see a cliff where “healthy” ends and “diseased” beginsyou see a slope.
Yet in real life, doctors and health systems need categories to answer practical questions:
- Who should be screened more often?
- When do benefits of treatment outweigh risks?
- Who qualifies for medications or insurance coverage?
- How do we compare research studies?
- How do we communicate risk clearly?
So medicine does what humans always do with messy reality: it creates definitions. Not because nature is neat,
but because decisions have deadlines.
“Arbitrary” doesn’t mean “made up”
Calling a cutoff “arbitrary” can sound like a roast, but it’s usually shorthand for:
there isn’t a single biologic breakpoint.
A number is selected because it’s usefulnot because it’s magical.
Guideline committees typically pick thresholds using combinations of:
- Risk curves: At what level does the risk of harm rise meaningfully?
- Treatment evidence: Who clearly benefits from treatment in trials?
- Test performance: What cutoff balances missed cases vs. false alarms?
- Measurement realities: How variable is the test day to day?
- Feasibility: What can health systems actually implement?
In other words: the number is a decision point, not a declaration that your body has crossed into a new species.
Seven real-world examples where a single number can change the label
1) Diabetes and prediabetes: the A1C “cliff” that isn’t a cliff
The A1C test estimates average blood sugar over the past 2–3 months. In many U.S. guidelines and patient-facing resources,
prediabetes is commonly defined as an A1C of 5.7% to 6.4%, and diabetes as
6.5% or higher. Fasting and oral glucose tolerance tests also have diagnostic cutoffs (for example, fasting
glucose 126 mg/dL or higher for diabetes). And in someone with classic symptoms, a random glucose
200 mg/dL or higher can meet criteria.
Notice what’s missing: a biological fireworks show at 6.5%. Risk rises with higher blood sugar, but it rises on a curve.
The cutoff is meant to identify people at high enough risk of complications to justify a diagnosis, follow-up, and (often)
treatmentwhile acknowledging that a person at 6.4% isn’t “fine” and a person at 6.5% isn’t “doomed.”
Practical takeaway: if you’re near the line, the trend, repeat testing, and your overall risk profile usually matter
as much as a single result.
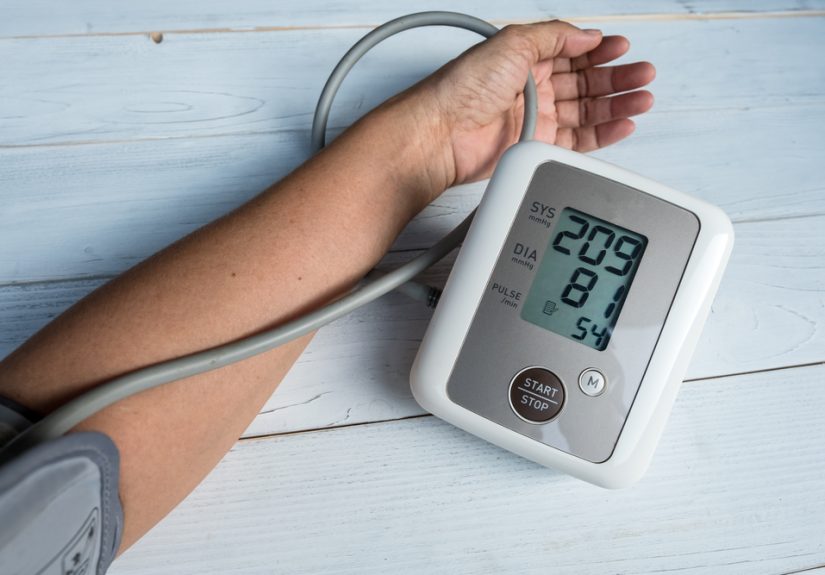
2) High blood pressure: when definitions change, the population changes
Blood pressure is the poster child for “continuum with consequences.” U.S. cardiology guidelines have defined hypertension stages
using thresholds (including 130/80 mm Hg as a key diagnostic boundary in widely used guidelines), which can reclassify
millions of people overnightwithout anyone’s arteries receiving a software update.
Why do this? Because cardiovascular risk increases as blood pressure increases, and evidence suggests earlier identification and
targeted treatment can reduce events in higher-risk groups. Still, clinicians often interpret the number in context:
home readings vs. office readings, overall cardiovascular risk, and whether lifestyle changes are likely to be enough.
Practical takeaway: one high reading is a headline, not a biography. Good measurement and repeat readings matter.
3) Cholesterol: the “high” label is partly about risk, not just a lab value
You’ll see common U.S. public health messaging that total cholesterol above 200 mg/dL may be considered high.
But cholesterol management is also deeply risk-based: two people with the same LDL can get very different recommendations
depending on whether they’ve already had cardiovascular disease, have diabetes, smoke, or have other risk factors.
Even within guidelines, you’ll find “thresholds” that are really prompts for decision-makinglike LDL levels used to consider adding
medications in certain high-risk groups. It’s less “this number equals disease” and more “this number suggests your risk-benefit math
is shifting.”
Practical takeaway: cholesterol is a team sportnumbers plus risk factors plus family history plus lifestyle.
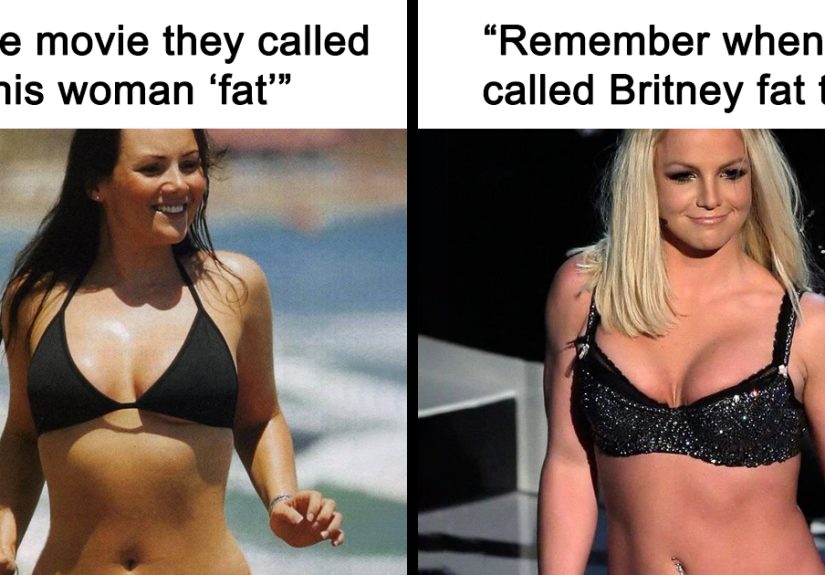
4) Obesity: BMI cutoffs are convenient… and incomplete
Body mass index (BMI) is widely used because it’s quick, inexpensive, and standardized. In U.S. public health definitions,
adult overweight often begins at BMI 25 and obesity at BMI 30.
The catch: BMI can’t see muscle mass, body fat distribution, or metabolic health.
That’s why a highly muscular athlete can be “obese” on paper, and someone with a “normal” BMI can still have high visceral fat and
cardiometabolic risk. BMI cutoffs are useful for population-level screening, but they’re blunt tools for individual health.
Practical takeaway: if BMI is near a cutoff, ask about waist circumference, blood pressure, lipids, blood sugar, sleep, activity,
and overall healthnot just the label.
5) Chronic kidney disease (CKD): a time requirement proves the point
Many U.S. kidney resources define CKD using both a number and a durationfor example, an
estimated glomerular filtration rate (eGFR) under 60 and/or elevated urine albumin for
three months or more. That time element is medicine basically saying, “We know numbers can wobblelet’s not overreact
to a single test.”
CKD is also staged by eGFR ranges, and those stages help guide monitoring, medication dosing, and cardiovascular risk management.
But eGFR naturally declines with age, and context matters: hydration, temporary illness, certain medications, and lab variability can
shift the estimate.
Practical takeaway: CKD labels often require confirmation over time and additional urine testingnot a one-and-done verdict.
6) Osteoporosis: a T-score line in the sand, plus fracture reality
Osteoporosis is frequently diagnosed using bone mineral density (BMD) testing (DXA). Research and clinical practice commonly use a
T-score of −2.5 or lower as a diagnostic threshold. But fractures don’t politely wait for you to hit a specific decimal.
Some people fracture above that cutoff, and some people below it never dobecause fracture risk also depends on age, falls, medications,
smoking, family history, and more.
That’s why clinicians often combine BMD with other risk tools and history, rather than treating the T-score like a magical sorting hat.
Practical takeaway: bone density is a major input, not the whole story. Fall risk and overall health matter a lot.
7) COPD and the “fixed ratio” debate: when the cutoff is openly called arbitrary
Chronic obstructive pulmonary disease (COPD) is often identified by airflow obstruction on spirometry. A commonly used criterion is an
FEV1/FVC ratio < 0.70 after bronchodilator. Here’s the spicy part: experts have explicitly described the 0.70 fixed ratio
as arbitraryuseful, standardized, and easy to apply, but not perfect across ages.
Because lung function changes with age, a fixed cutoff can overdiagnose obstruction in some older adults and underdiagnose it in younger
adults. This is a great example of medicine choosing a number for practicality, then continuously arguing (productively!) about whether
a better approach exists.
Practical takeaway: if spirometry results are borderline, interpretation should consider symptoms, exposures (like smoking), imaging,
and alternative thresholds.
Why these numbers change over time (and why that’s not a scam)
When thresholds move, it can feel like the health system is “inventing patients.” Sometimes, expanding definitions does increase the number
of people labeled. But the motives are usually more boringand more evidence-basedthan conspiracy:
- New trial data: showing benefit earlier (or harm from overtreatment).
- Better risk prediction: improving who gets treated vs. who gets watched.
- Improved testing: changing what a lab value means in practice.
- Public health priorities: earlier detection to prevent severe outcomes later.
The healthiest mindset is: guidelines are updated maps. The coastline didn’t suddenly move, but we got a better satellite image.
How to use diagnostic cutoffs without letting them use you
Ask “What does this number mean for me?”
A cutoff might be a strong signal for one person and a weak signal for another. Context includes age, family history, medications,
pregnancy status, other conditions, and overall risk.
Confirm borderline results
Many conditions require repeat testing or multiple readings because single measurements can be noisy. Home blood pressure monitoring,
repeat A1C, repeat fasting glucose, or repeat eGFR/urine albumin tests can clarify whether a number is persistent or a fluke.
Focus on trends, not trophies
Health is not a video game where you “beat” diabetes by scoring 6.4%. If you’re near a threshold, improving sleep, activity, nutrition,
and stress management is still meaningful, even if your lab value doesn’t cross a line dramatically.
Don’t ignore “almost”
“Not quite diabetic” does not mean “no problem.” Prediabetes exists because risk is already higher, and lifestyle changes can be powerful.
Similarly, “elevated” blood pressure isn’t nothingit’s often an early warning worth taking seriously.
Be wary of labels that replace conversations
A diagnosis should open a discussion: What are the options? What’s the benefit? What are the downsides? What can I do now?
If a label shuts down nuance, it’s being used incorrectly.
Conclusion: The number is the start of the story, not the ending
Many diseases represent an arbitrary number because medicine often has to convert gradual biology into actionable decisions.
Those cutoffs are rarely randomthey’re chosen to balance risk, evidence, test accuracy, and real-world practicality.
The best way to think about a borderline diagnosis is this: the number is a signal, not a sentence.
Use it to ask better questions, confirm what needs confirming, and make sustainable changes that lower risk over time.
Your body is not a checkbox, and your health is not one decimal point.
Experiences related to “Many diseases represent an arbitrary number” (real-life snapshots)
Because these cutoffs live at the intersection of science and everyday life, people tend to experience them emotionallynot just clinically.
Here are a few composite “you could overhear this in any waiting room” moments that show how an arbitrary number can feel very real.
Snapshot 1: The “I’m sick now?” phone call
A patient gets a portal notification: A1C 6.5%. Yesterday they were “prediabetic,” today they’re “diabetic.” Nothing about their body feels
different. They still walked the dog. They still went to work. The jarring part isn’t the biologyit’s the label. In the follow-up visit,
the most helpful sentence is often, “This doesn’t mean you suddenly changed overnight; it means we’re going to take prevention more seriously.”
The diagnosis becomes less of a trapdoor and more of a roadmap.
Snapshot 2: The blood pressure paradox
Someone measures 138/86 at the doctor’s office and hears “high blood pressure.” At home, they’re 124/78 all week. Now they’re wondering if
they should start medication or if their blood pressure is just shy around stethoscopes. This is where numbers become a negotiation between
measurement and meaning. A clinician who leans on home monitoring can turn anxiety into data, and data into a plansometimes lifestyle first,
sometimes medication if overall cardiovascular risk is high. Either way, the “arbitrary” cutoff becomes a prompt to measure better.
Snapshot 3: The BMI label that doesn’t fit the mirror
A former college athletestill strong, still liftingsees “obesity” on a form because BMI is 30.2. They feel unfairly judged by a calculator.
A better conversation might sound like: “BMI is a screening tool. Let’s check blood pressure, labs, waist measurement, sleep, and how you feel.
We’ll use the label only if it helps guide care.” When the clinician treats BMI as a starting point rather than a personality assessment, the
patient is more likely to engage instead of shutting down.
Snapshot 4: The kidney number that changes with a stomach bug
Someone has a brief illness, gets dehydrated, and their eGFR drops below 60 on a lab test. The word “chronic” in chronic kidney disease feels
heavyespecially when the problem may not be chronic at all. The experience many people share is relief when they learn that CKD definitions
often require persistence for months and additional urine testing. Repeat labs after recovery can tell the difference between a temporary dip
and a long-term issue. The big lesson: a single number, taken out of context, can create more fear than clarity.
Snapshot 5: The bone density “border” and the fall that matters more
A patient’s T-score is −2.4osteopenia, not osteoporosis. They feel oddly “lucky,” even though they’ve already had a low-trauma wrist fracture.
Another patient has a T-score of −2.6 but is steady on their feet, strength-trains, and hasn’t fallen in years. In real life, fracture history,
balance, medications that increase fall risk, and home safety can matter as much as a hundredth of a T-score point. People often feel empowered
when the plan includes practical stepsstrength training, vision checks, reviewing sedating medicationsbecause those actions don’t depend on
crossing a numerical border.
These experiences have a common theme: the cutoff is real, but it’s not personal. The most helpful medical care uses the number to start a
conversation about risk and choicesnot to slap on a label and walk away.