Table of Contents >> Show >> Hide
- What Is a Growth Rate (and Why Should You Care)?
- Step 1: Define What You’re Measuring (and the Time Period)
- Step 2: Gather Clean “Beginning” and “Ending” Values
- Step 3: Choose the Right Growth Rate Type
- Step 4: Calculate the Absolute Change First
- Step 5: Calculate the Simple Growth Rate (Percent Change)
- Step 6: Use CAGR for Multi-Year Growth (and Annualize When Needed)
- Step 7: Sanity-Check, Add Context, and Communicate Clearly
- Common Growth Rate Mistakes (and How to Avoid Them)
- Conclusion
- Experience Section: Real-World Growth Rate Lessons (Extra 500+ Words)
Growth rate is one of those deceptively simple numbers that can make you feel like a financial wizardor like you just tried to divide by a bagel.
The good news: you don’t need a crystal ball, an MBA, or a calculator blessed by an accountant. You just need the right formula, the right timeframe,
and a tiny bit of discipline (the math kind, not the “wake up at 5 a.m.” kind).
In this guide, you’ll learn how to calculate growth rate in 7 practical steps, plus when to use
simple growth, year-over-year (YoY) growth, month-over-month (MoM), and the fan-favorite:
compound annual growth rate (CAGR). We’ll also cover common mistakes, real examples, and quick Excel shortcuts.
What Is a Growth Rate (and Why Should You Care)?
A growth rate measures how much something changes over timeusually expressed as a percentage.
That “something” could be revenue, users, website traffic, rent (unfortunately), or the number of times your team says “quick question” in Slack.
When you calculate growth rate correctly, you can:
- Track performance over time (are you improving or just getting louder?).
- Compare periods fairly (this quarter vs. last quarter, this year vs. last year).
- Forecast trends using realistic assumptions (not vibes).
- Communicate results clearly to stakeholders who love charts and hate surprises.
The key is choosing the right type of growth rate for your situationand calculating it in a way that doesn’t accidentally create fiction.
Step 1: Define What You’re Measuring (and the Time Period)
Before you touch a formula, decide what your metric is and how the “before” and “after” are defined.
Growth rate is always “from X to Y over a specific period.”
Pick the metric
- Business: revenue, profit, customers, churn, units sold, conversion rate
- Marketing/SEO: organic sessions, leads, CTR, impressions, rankings
- Investing: portfolio value, share price, dividends reinvested value
- Economics: GDP, unemployment rate, productivity
Pick the interval
Common timeframes include daily, weekly, monthly, quarterly, and yearly.
The rule: choose the interval that matches how decisions get made.
If your leadership team meets monthly, a yearly metric might be too slow to steer the ship.
Pro tip: For seasonal businesses (retail, travel, education), compare apples to apples:
January this year vs. January last year (YoY) is usually more honest than December vs. January (MoM).
Step 2: Gather Clean “Beginning” and “Ending” Values
Growth calculations are only as good as your inputs. Your job here is to prevent “garbage in, garbage out” from becoming your quarterly theme.
What counts as “beginning” and “ending”?
- Point-in-time: value on the first and last day of the period (common for investments)
- Period totals: total revenue for Q1 vs. total revenue for Q2 (common for business reporting)
- Averages: average daily active users for the month vs. next month (common for product metrics)
Adjust when needed (optional but smart)
Sometimes “growth” is inflated by factors that don’t reflect real performance:
- Inflation: revenue can rise because prices rose, not because you sold more.
- One-time events: a single bulk order can distort a month.
- Data gaps: missing tracking or reporting changes can create fake dips/spikes.
If you’re reporting to decision-makers, consider noting whether the numbers are nominal (raw) or real (inflation-adjusted).
It’s the difference between “we grew” and “we grew… because everything got more expensive.”
Step 3: Choose the Right Growth Rate Type
Not all growth rates answer the same question. Pick the one that matches what you’re trying to prove (or disprove).
Simple growth rate (most common)
Best for: one period to the next (e.g., last year to this year), quick comparisons, dashboards.
Average growth rate (AAGR)
Best for: averaging a series of yearly growth rates (useful, but can be misleading if volatility is high).
Compound annual growth rate (CAGR)
Best for: multi-year trends, smoothing volatility, comparing “uneven” growth patterns.
CAGR answers: “What steady yearly rate would get me from start to finish?”
MoM, QoQ, YoY
These are simple growth rates with standard timeframes:
MoM = month-over-month, QoQ = quarter-over-quarter, YoY = year-over-year.
If you’re unsure: start with simple growth rate. If you’re spanning multiple years and want a clean comparison,
use CAGR.
Step 4: Calculate the Absolute Change First
Before percentages, compute the raw change. This keeps you grounded in reality and helps you catch mistakes early.
Absolute change:
Example: Revenue rose from $250,000 to $310,000.
That “+60k” is meaningful on its own. Percentages are great, but raw change answers,
“How many actual dollars/users/sessions did we gain?”
Step 5: Calculate the Simple Growth Rate (Percent Change)
This is the classic growth rate formula you’ve seen in finance, business, and every middle-school math test designed to humble you.
Simple growth rate:
As a percentage:
Worked example (revenue growth rate)
Beginning revenue: $250,000
Ending revenue: $310,000
Result: 24% growth over the period.
Quick interpretation
- Positive: you grew.
- Zero: you stayed flat (congrats on your consistency?).
- Negative: you shrank (still usefulnow you can diagnose why).
Edge case warning: If the beginning value is 0, this formula breaks (division by zero).
In those cases, use absolute change, or define a different baseline (like first non-zero period).
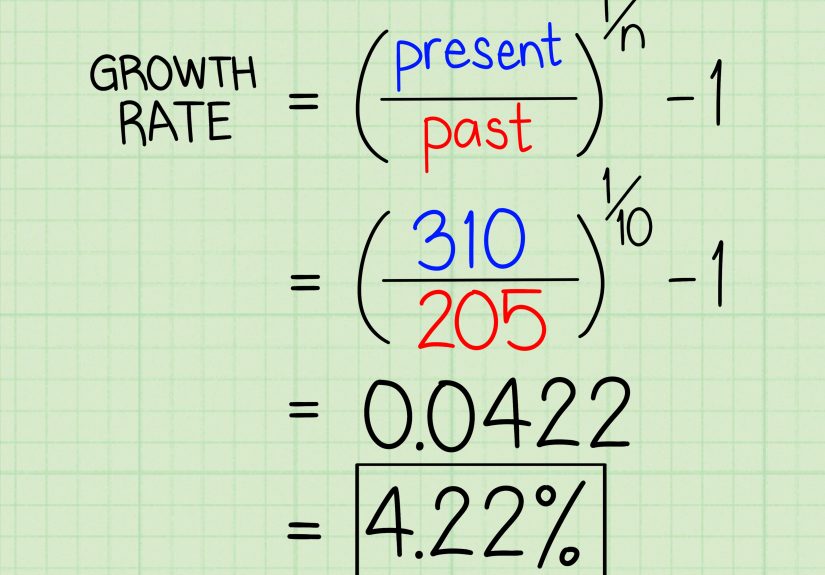
Step 6: Use CAGR for Multi-Year Growth (and Annualize When Needed)
If your growth spans more than one year (or you want a clean “per year” number),
CAGR is your best friend. It smooths the chaos into a single annualized rate.
CAGR formula
Worked example (3-year CAGR)
Suppose sales increased from $1,000,000 to $1,520,000 over 3 years.
Result: about 14.9% CAGR per year.
Translation: “If you grew at a steady 14.9% annually, you’d end up at the same place.”
Annualizing shorter periods (optional)
Sometimes you have monthly or quarterly growth and want an “annualized” rate.
That’s compounding, not multiplying.
- Monthly to annualized: Annualized = (1 + monthly rate)12 − 1
- Quarterly to annualized: Annualized = (1 + quarterly rate)4 − 1
Example: If MoM growth is 2% (0.02), annualized growth is:
That’s why small monthly gains are powerfuland also why “just 2%” is rarely “just 2%.”
Excel shortcuts
- Simple growth rate:
=(End-Start)/Start - CAGR:
=(End/Start)^(1/Years)-1 - Excel RRI:
=RRI(Years, Start, End)(returns the rate per period)
Step 7: Sanity-Check, Add Context, and Communicate Clearly
The math is done. Now comes the part where people get themselves into trouble: interpretation.
A growth rate without context can be technically correct and still wildly misleadinglike saying
“I improved my cooking by 300%” after learning to boil water.
Sanity checks that save reputations
- Check the baseline: a small starting number can create huge percentages.
- Look for one-time spikes: promotions, outages, bulk orders, tracking changes.
- Confirm units: dollars vs. thousands, users vs. active users, sessions vs. clicks.
- Compare like-for-like: YoY is often best for seasonal data.
Add context with benchmarks
Is 10% growth “good”? It depends. Compare against:
- Your historical average (your own trendline is the fairest judge).
- Industry norms (growth rates vary wildly by sector).
- Company targets (because someone, somewhere, promised investors “aggressive expansion”).
Show it visually
A simple line chart or bar chart can reveal whether growth is steady, seasonal, or “a rollercoaster built by a caffeinated squirrel.”
If you report growth, consider including both:
- Percent growth (relative change)
- Absolute change (real-world impact)
Common Growth Rate Mistakes (and How to Avoid Them)
1) Dividing by the ending value
The standard percent change formula divides by the beginning value, not the ending value.
Dividing by the ending value answers a different question and makes comparisons inconsistent.
2) Using AAGR when volatility is high
Average growth rates can exaggerate performance when returns swing.
For multi-year comparisons, CAGR is usually more honest.
3) Ignoring negative starting values
If the beginning value is negative (like negative profit) and the ending value is positive,
percent growth can produce confusing results. In those cases, explain the story using:
absolute change, margin improvement, or “moved from a loss to a profit” language.
4) Comparing different measurement rules
If one year’s “revenue” includes refunds and another doesn’t, your growth rate is a remix, not a metric.
Align definitions first, calculate second.
Conclusion
Calculating growth rate doesn’t have to be complicated. Once you define the metric and timeframe, clean your values,
pick the right approach (simple growth vs. CAGR), and sanity-check your result, you’ll have a number you can trustand explain.
The best part? Growth rate isn’t just a math trick. It’s a decision-making tool. When you measure growth consistently, you can spot trends early,
communicate performance clearly, and make smarter bets with fewer “how did we miss this?” moments.
Experience Section: Real-World Growth Rate Lessons (Extra 500+ Words)
After you calculate growth rates for a while, you start realizing the real challenge isn’t the formulait’s humans.
Humans love a big percentage. Humans also love ignoring the tiny baseline that created it. This is how dashboards become comedy.
One of the most common situations I’ve seen is the “We grew 300%!” announcement. Everyone cheers.
Then you ask, “From what to what?” and the room gets awkwardly quiet. Because the answer is often:
“From 10 to 40.” That is technically 300% growth, and it’s also exactly 30 more whatever-it-is. Both statements are true.
The lesson: always pair percentage growth with absolute growth, especially when starting values are small.
A tiny base can make decent progress look like a miracleand miracles make planning impossible.
Another lesson: seasonality will embarrass you if you let it. I’ve watched teams panic because traffic dropped from December to January.
But for many industries, that “drop” is just the calendar doing what the calendar does. If your business is seasonal,
YoY growth is your calming cup of tea. January vs. last January tells you whether performance actually improved,
not whether people stopped shopping the moment the holidays ended (spoiler: they did).
CAGR has its own personality quirks. It’s the smooth-talking friend who makes everything sound stable.
That’s useful for long-term comparisons, investor updates, and strategic planning.
But it can also hide drama. If revenue went up, down, and sideways over five years, CAGR will politely summarize it as one tidy number.
So when the stakes are high, I treat CAGR like a movie trailer: helpful, but I still want to watch the film.
I’ll calculate CAGR, then I’ll also look at the year-by-year growth rates to see where volatility lives.
A practical “in the trenches” tip: be careful when someone changes reporting definitions midstream.
If the analytics tool changed attribution windows, or finance updated revenue recognition rules, your growth rate might reflect a definition change,
not a performance change. When I suspect that, I do a quick audit:
- Confirm the metric definition for both periods (what’s included, what’s excluded).
- Check if any one-time events happened (campaigns, outages, pricing changes).
- Recalculate using an alternate view (like units sold instead of revenue, or active users instead of signups).
Finally, here’s the best growth-rate habit I’ve ever adopted: write down the story you expect before you calculate.
Something like, “We launched feature X, so retention should improve slightly, maybe 2–4%.”
Then calculate. If you get +40%, you don’t immediately celebrateyou investigate. Either you struck gold,
or your tracking is counting something twice, or you accidentally compared a week to a month.
Growth rates are powerful, but they’re not magic. The magic is using them honestly.